> ## Documentation Index
> Fetch the complete documentation index at: https://laminarai-docs-lam-1786-dataset-cli-lmnr-cli.mintlify.site/llms.txt
> Use this file to discover all available pages before exploring further.
# AI Agent Debugger: Record, Replay, Evaluate
Building an agent is a loop: run it, see what it did, change something, run it again. When your coding agent drives that loop, it needs to see what the agent did as clearly as you would, and it can't afford to wait minutes for a full run on every change.
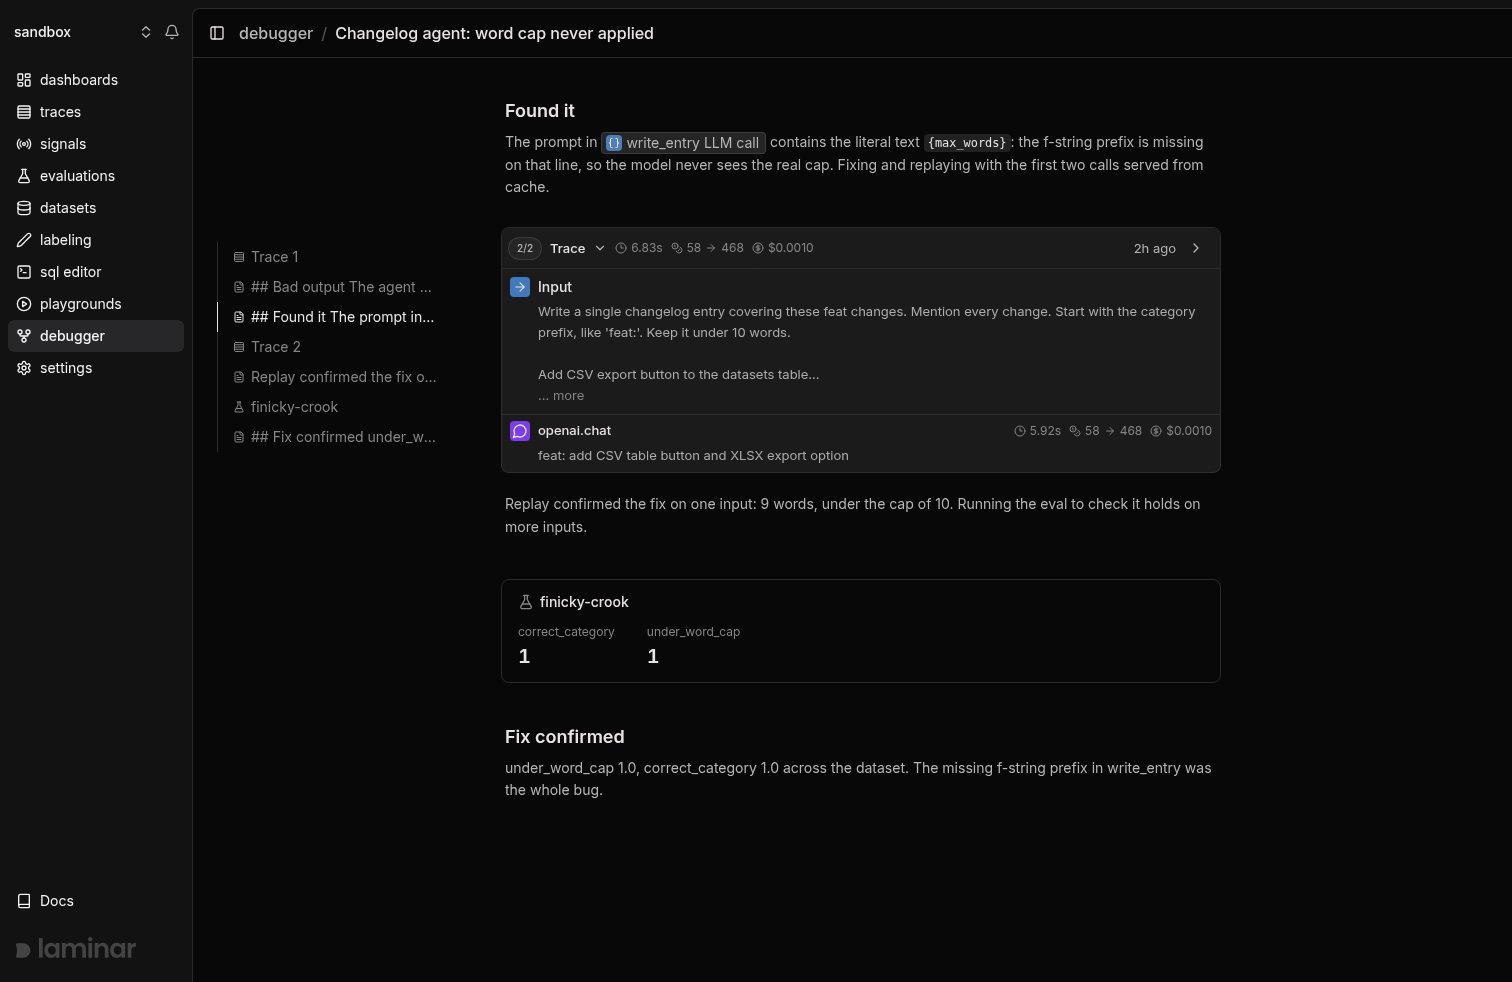
**The Laminar debugger is that loop, built for a coding agent to run.** Claude Code, Cursor, or Codex runs your agent, reads the resulting trace in Laminar to understand what worked and what didn't, changes your code, and runs again, with each rerun served from cache up to the point it's testing so the turn is fast and cheap. Every run, evaluation, and note lands in one [session](/debugger/process) you watch live.
 ## The iteration loop
One turn of the loop has four steps. A coding agent with the [Laminar skill](https://github.com/lmnr-ai/lmnr-skills) runs all four on its own; you can run any of them by hand.
1. **Run.** Start your agent with `LMNR_DEBUG=true`. The run is traced and recorded into the session.
2. **Read.** Open the trace in Laminar and read the transcript: the agent's inputs, every LLM turn, every tool call, sub-agents collapsed into cards. This is where *what worked and what didn't* becomes obvious, for you and for the coding agent reading the same trace.
3. **Change.** Edit the agent: the prompt, a tool, the control flow, whatever the trace pointed at.
4. **Run again.** Rerun against the recorded trace. Everything before the call you're testing comes back from cache instantly; only your change and what follows it run live. The new run is a fresh trace in the same session, next to the last one.
The point is the turnaround. An agent run can take minutes end to end, and the call you're fixing is often three-quarters of the way through. Caching the prefix means the coding agent can take that turn dozens of times in the span it would take one live run to finish. See [how caching works](/debugger/caching) for the mechanism, or walk the whole loop on a real bug in the [end-to-end guide](/guides/debugger-end-to-end).
## Prove the fix with an eval
A single replay shows the fix works on one input. To show it works in general, run your [evaluation](/evaluations/introduction) with `LMNR_DEBUG=true`: the eval joins the same session automatically and renders as a card with per-score averages, each score marked with its change against the previous eval in the session. Fix, replay, eval, compare: the whole arc of an investigation sits in one timeline. See [the debugger process](/debugger/process#5-prove-the-fix-with-an-eval) for the commands.
## Who drives the loop
The loop is the same whoever runs it, and you watch it from the same session view either way. Hand it to a **coding agent** and watch: with the [Laminar skill](https://github.com/lmnr-ai/lmnr-skills) it runs your agent, reads the trace, edits your code, and reruns on its own, leaving notes so you can follow along without touching the terminal. Stay **in the loop** by reading each run as it lands and pointing the agent at the span that's wrong, or **drive it yourself**: every step is a CLI command or an environment variable, no coding agent required.
## Sessions, replay, and blocks
Three primitives make the loop work:
* **Sessions** group everything from one investigation. The first `LMNR_DEBUG=true` run starts a session and writes `.lmnr/debug-session.json`; every later run in the same directory (or any subdirectory) rejoins it automatically, so neither you nor the agent copies a session id between runs.
* **Replay** is what makes a turn fast. Rerunning against a recorded trace serves cached LLM responses up to the boundary you pick and runs everything past it live, so you only pay for the calls your change actually touched. See [how caching works](/debugger/caching).
* **Blocks** are what a session contains: an ordered timeline of runs (traces), evaluations, and notes, sorted by time. The UI renders the same timeline the CLI prints with [`lmnr-cli debug session summary`](/platform/cli#debug-session-summary), so a human and a coding agent read the same story.
## What's next
Install the CLI, run setup, and let your coding agent take it from there.
The full run, read, change, rerun, and eval loop, step by step.
What gets cached, how the input hash works, and which integrations support it.
Full reference for the `lmnr-cli debug session` commands.
## The iteration loop
One turn of the loop has four steps. A coding agent with the [Laminar skill](https://github.com/lmnr-ai/lmnr-skills) runs all four on its own; you can run any of them by hand.
1. **Run.** Start your agent with `LMNR_DEBUG=true`. The run is traced and recorded into the session.
2. **Read.** Open the trace in Laminar and read the transcript: the agent's inputs, every LLM turn, every tool call, sub-agents collapsed into cards. This is where *what worked and what didn't* becomes obvious, for you and for the coding agent reading the same trace.
3. **Change.** Edit the agent: the prompt, a tool, the control flow, whatever the trace pointed at.
4. **Run again.** Rerun against the recorded trace. Everything before the call you're testing comes back from cache instantly; only your change and what follows it run live. The new run is a fresh trace in the same session, next to the last one.
The point is the turnaround. An agent run can take minutes end to end, and the call you're fixing is often three-quarters of the way through. Caching the prefix means the coding agent can take that turn dozens of times in the span it would take one live run to finish. See [how caching works](/debugger/caching) for the mechanism, or walk the whole loop on a real bug in the [end-to-end guide](/guides/debugger-end-to-end).
## Prove the fix with an eval
A single replay shows the fix works on one input. To show it works in general, run your [evaluation](/evaluations/introduction) with `LMNR_DEBUG=true`: the eval joins the same session automatically and renders as a card with per-score averages, each score marked with its change against the previous eval in the session. Fix, replay, eval, compare: the whole arc of an investigation sits in one timeline. See [the debugger process](/debugger/process#5-prove-the-fix-with-an-eval) for the commands.
## Who drives the loop
The loop is the same whoever runs it, and you watch it from the same session view either way. Hand it to a **coding agent** and watch: with the [Laminar skill](https://github.com/lmnr-ai/lmnr-skills) it runs your agent, reads the trace, edits your code, and reruns on its own, leaving notes so you can follow along without touching the terminal. Stay **in the loop** by reading each run as it lands and pointing the agent at the span that's wrong, or **drive it yourself**: every step is a CLI command or an environment variable, no coding agent required.
## Sessions, replay, and blocks
Three primitives make the loop work:
* **Sessions** group everything from one investigation. The first `LMNR_DEBUG=true` run starts a session and writes `.lmnr/debug-session.json`; every later run in the same directory (or any subdirectory) rejoins it automatically, so neither you nor the agent copies a session id between runs.
* **Replay** is what makes a turn fast. Rerunning against a recorded trace serves cached LLM responses up to the boundary you pick and runs everything past it live, so you only pay for the calls your change actually touched. See [how caching works](/debugger/caching).
* **Blocks** are what a session contains: an ordered timeline of runs (traces), evaluations, and notes, sorted by time. The UI renders the same timeline the CLI prints with [`lmnr-cli debug session summary`](/platform/cli#debug-session-summary), so a human and a coding agent read the same story.
## What's next
Install the CLI, run setup, and let your coding agent take it from there.
The full run, read, change, rerun, and eval loop, step by step.
What gets cached, how the input hash works, and which integrations support it.
Full reference for the `lmnr-cli debug session` commands.