
What a cluster is
A cluster is a group of signal events whose summaries are semantically similar. Laminar generates a short summary of each event’s payload, embeds it, and groups events by meaning rather than by exact wording, so “timeout calling the payments API” and “payments request exceeded deadline” land in the same cluster. Clustering is scoped to a single Signal: events from different Signals never share a cluster. Read top-down when you want the shape of the problem (“most failures are tool loops”). Read bottom-up when you want the specific example (“this one loop is the config-validation tool calling itself twelve times”).Clustering is fully automatic. There is nothing to enable per Signal and no thresholds to tune.
Where to find them
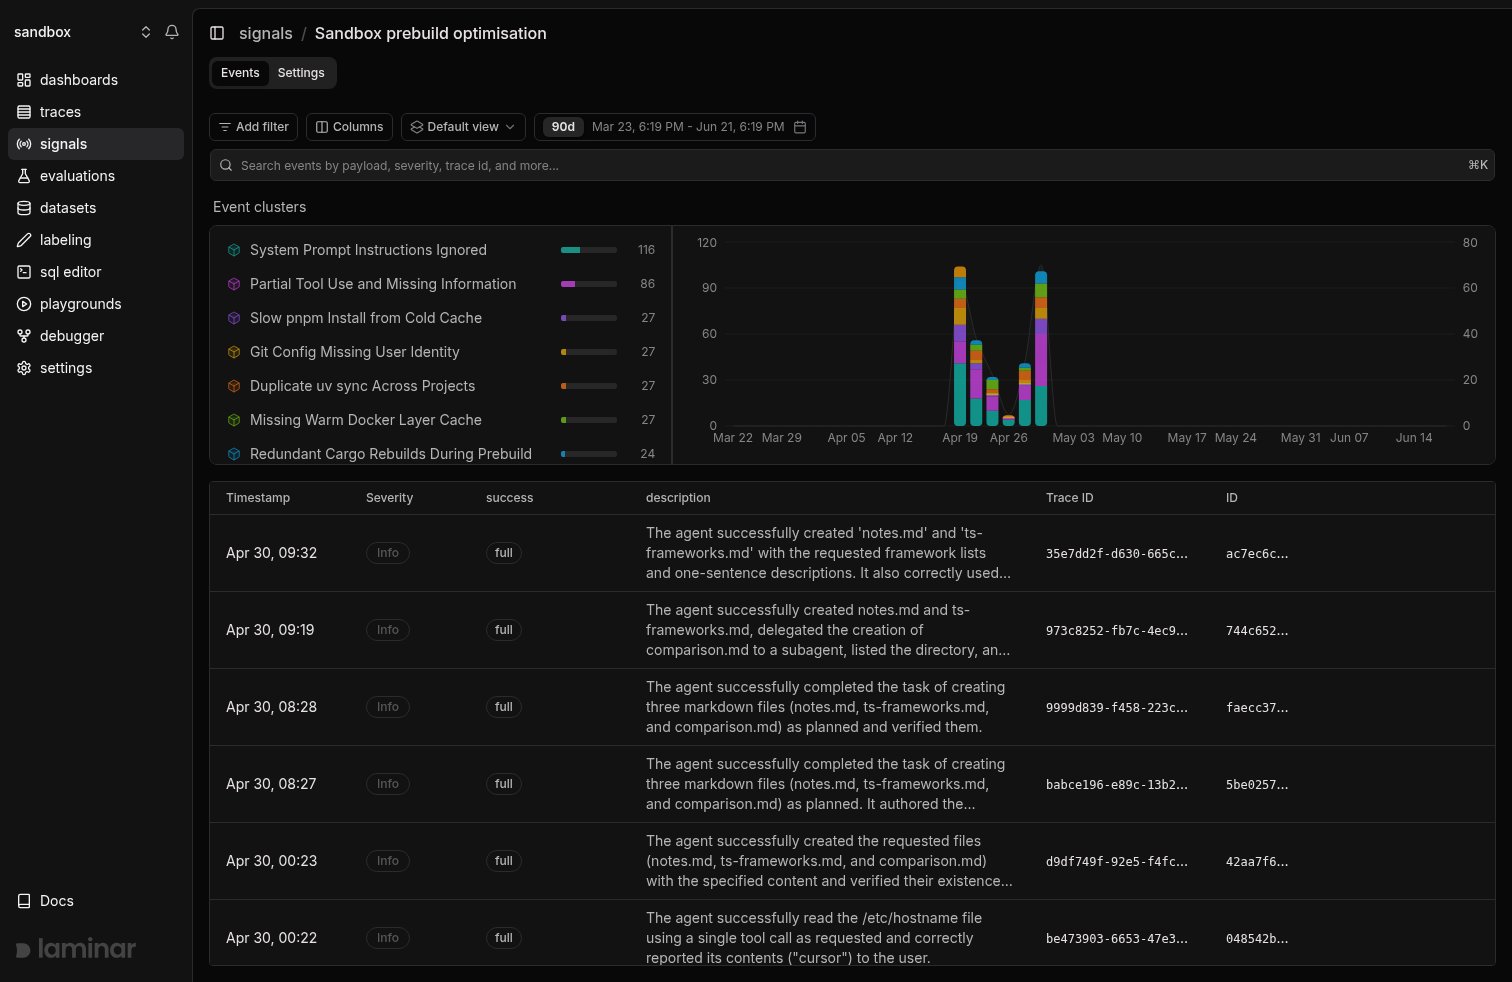
On any Signal detail page, open the Events tab. The clusters view sits below the events table, split into two resizable panels:- Left: the cluster list. Each row shows the cluster name, a proportion bar sized to its share of events, and the event count. Rows with sub-clusters expand in place; leaf clusters and the unclustered bucket have their own icons. Hover a row to see how many sub-clusters it has, its event count in the selected range, and when it was created and last updated.
- Right: a stacked frequency chart. Each cluster is a stacked series over time, with a Signal runs overlay so you can read cluster volume against how often the Signal ran.
How the hierarchy works
Clusters form a tree, up to a few levels deep:- Leaf clusters are the most specific named groups: events that describe near-identical behavior, like “config-validation tool retries in a loop”.
- Parent clusters group similar leaf clusters into broader patterns, like “tool call loops”. A parent’s events are the union of its children’s events, so counts add up as you move up the tree.
- The top level is a handful of broad categories that cover most of the Signal’s events. This is the view to start from during triage.
Below the named hierarchy there is an internal accumulation layer of small, unnamed groups. It is hidden from the UI and excluded from the
clusters SQL table; it exists so that one-off events don’t produce noisy single-event clusters.When events get clustered
Clustering runs asynchronously, after events are created:- Every new signal event is queued for clustering together with its summary.
- Queued events for the same Signal are processed in batches. A batch runs once enough events accumulate, or shortly after the first event arrives, typically within a minute.
- Each event in the batch either joins the closest existing cluster or starts a new one. A new named cluster appears once a couple of similar events have arrived; until then, one-off events sit in the Unclustered bucket.
- If the batch created new clusters or meaningfully changed existing ones, names are generated or refreshed.
- An event shows up in the events table immediately but can take a minute or two to land in a cluster. During a live incident, expect cluster counts to trail the event count slightly.
- A genuinely new failure mode surfaces as a new cluster shortly after the second similar event arrives. Pair this with a New cluster alert to hear about emerging failure modes without watching the page.
When clusters earn their keep
Clusters pay off when you have hundreds or thousands of events and an open-ended question:- Triage: “Of the 4,000 traces flagged by
agent_failurethis week, which handful of failure modes account for most of them?” - Regression detection: a cluster that was empty yesterday and full today is a new failure mode.
- Prompt tuning: if a cluster contains events you don’t consider matches, your prompt is too broad. If expected events split across unrelated clusters, your payload schema isn’t capturing the discriminating fields.
Querying clusters with SQL
Clusters are queryable in the SQL Editor:- The
clusterstable has one row per named cluster, includingname,level,parent_id, andnum_signal_events, so you can reconstruct the hierarchy or trend cluster sizes over time. - The
signal_eventstable has aclusterscolumn: the IDs of every cluster an event belongs to, from its most specific cluster up through its parents.
Next steps
Alerts
Fire Slack or email notifications on new signal events or clusters.
SQL Editor
Query the
clusters and signal_events tables directly.