
Every new Laminar project ships with a Failure Detector signal pre-created and triggered automatically on traces with more than 1000 tokens. It categorizes issues as
tool_error, api_error, logic_error, looping, wrong_tool, timeout, or other. You don’t need to build this one yourself. Open it from the Signals list to see events as soon as your traces start arriving.Prerequisites
- A Laminar project and
LMNR_PROJECT_API_KEY. - An agent or LLM app whose traces land in Laminar. The example below uses the Claude Agent SDK to produce traces quickly.
1. Generate traces
Any traced application will do. The Claude Agent SDK example below sends a handful of prompts and emits one trace per prompt. Enough to exercise a Signal end-to-end.quickstart_agent traces arrive.
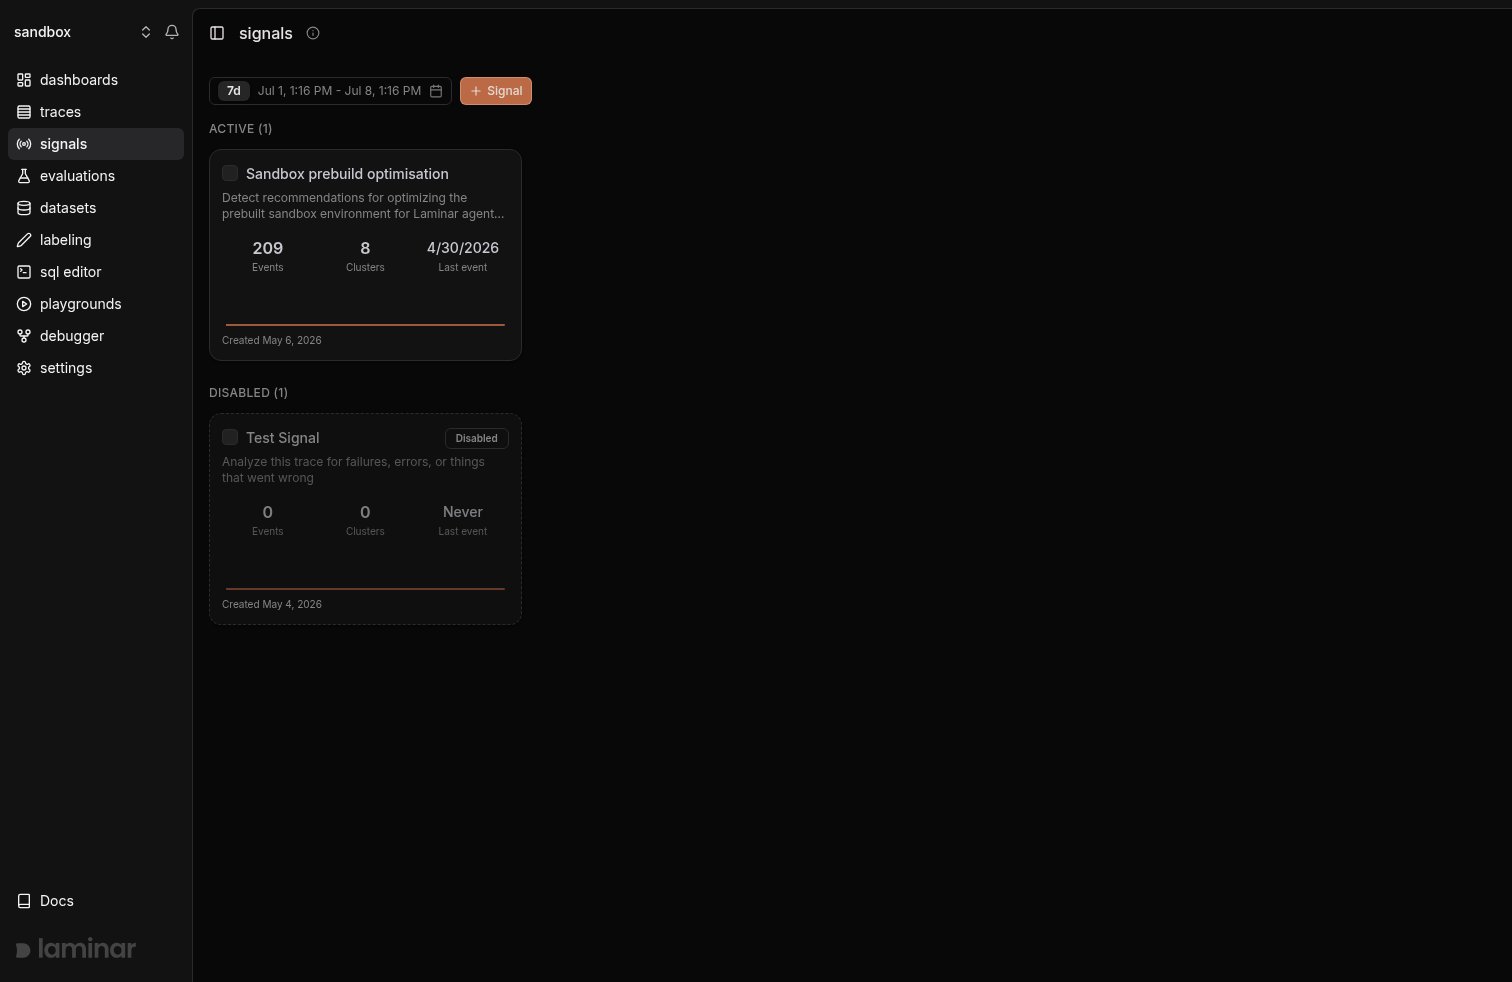
2. Open Signals
Click Signals in the project sidebar. If this is a new project, the Failure Detector signal is already there, ready to run on any trace over 1000 tokens.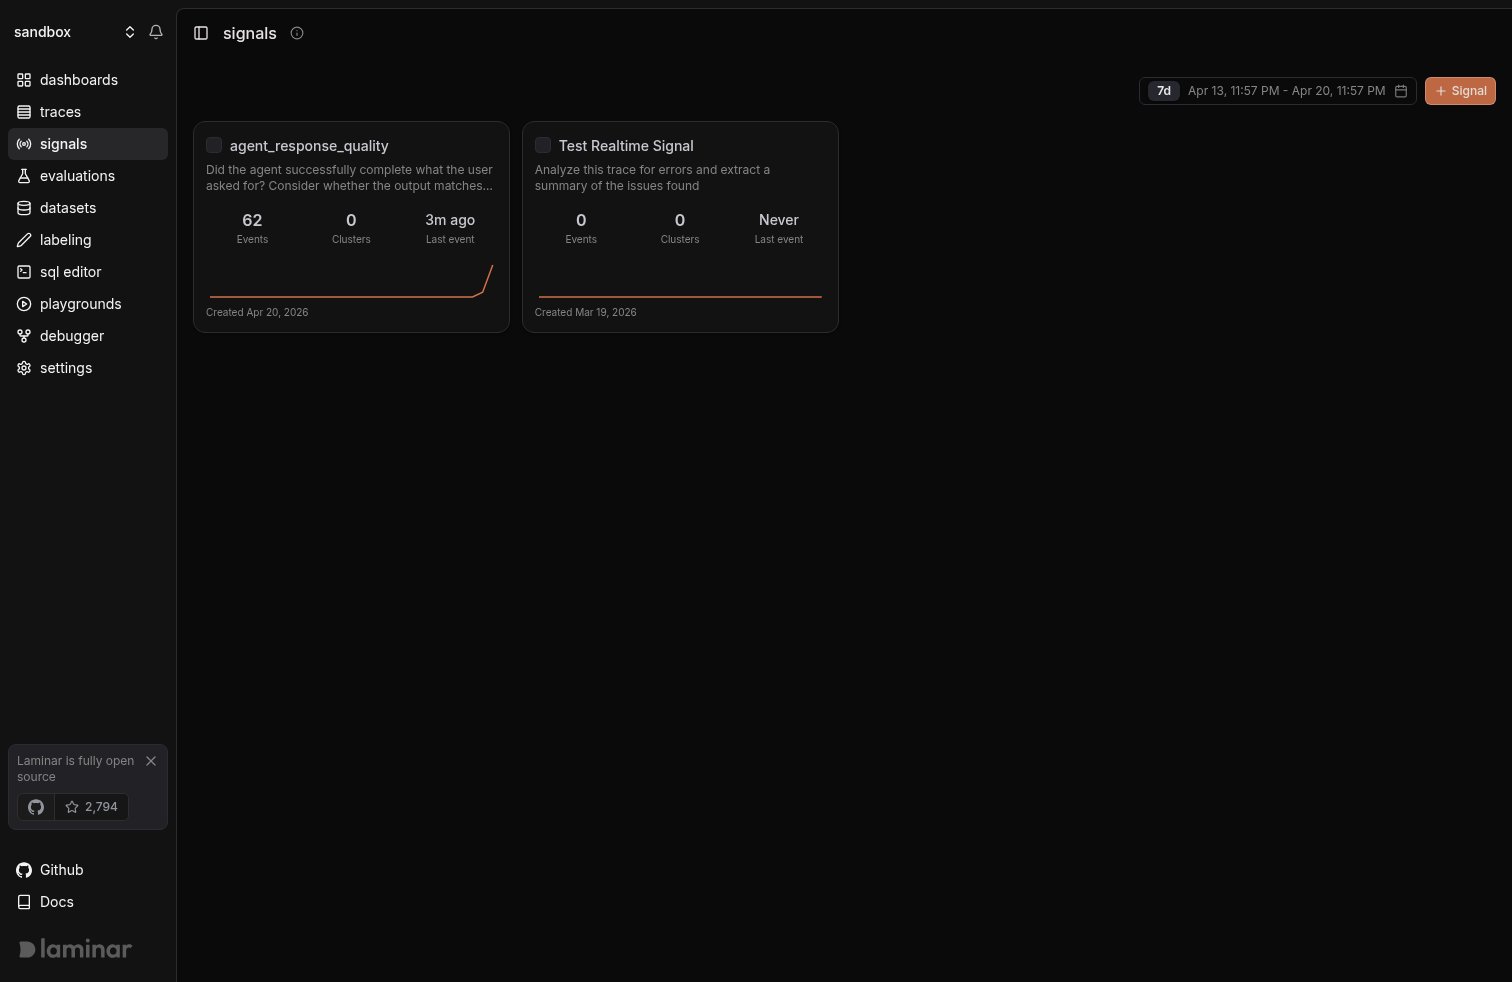
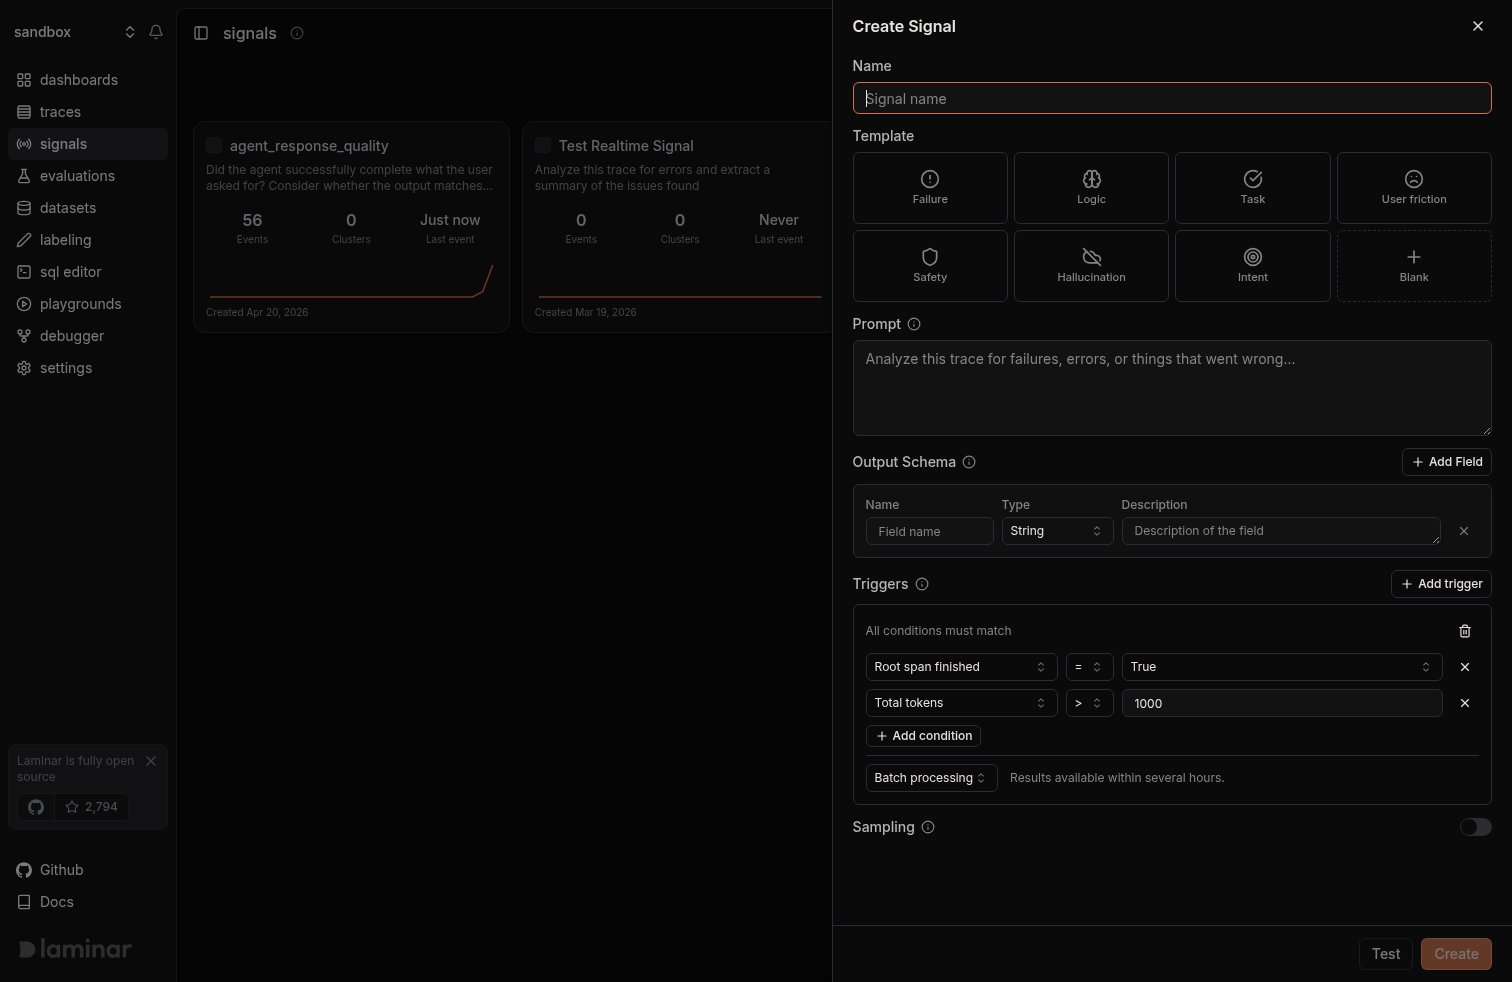
3. Write the Signal
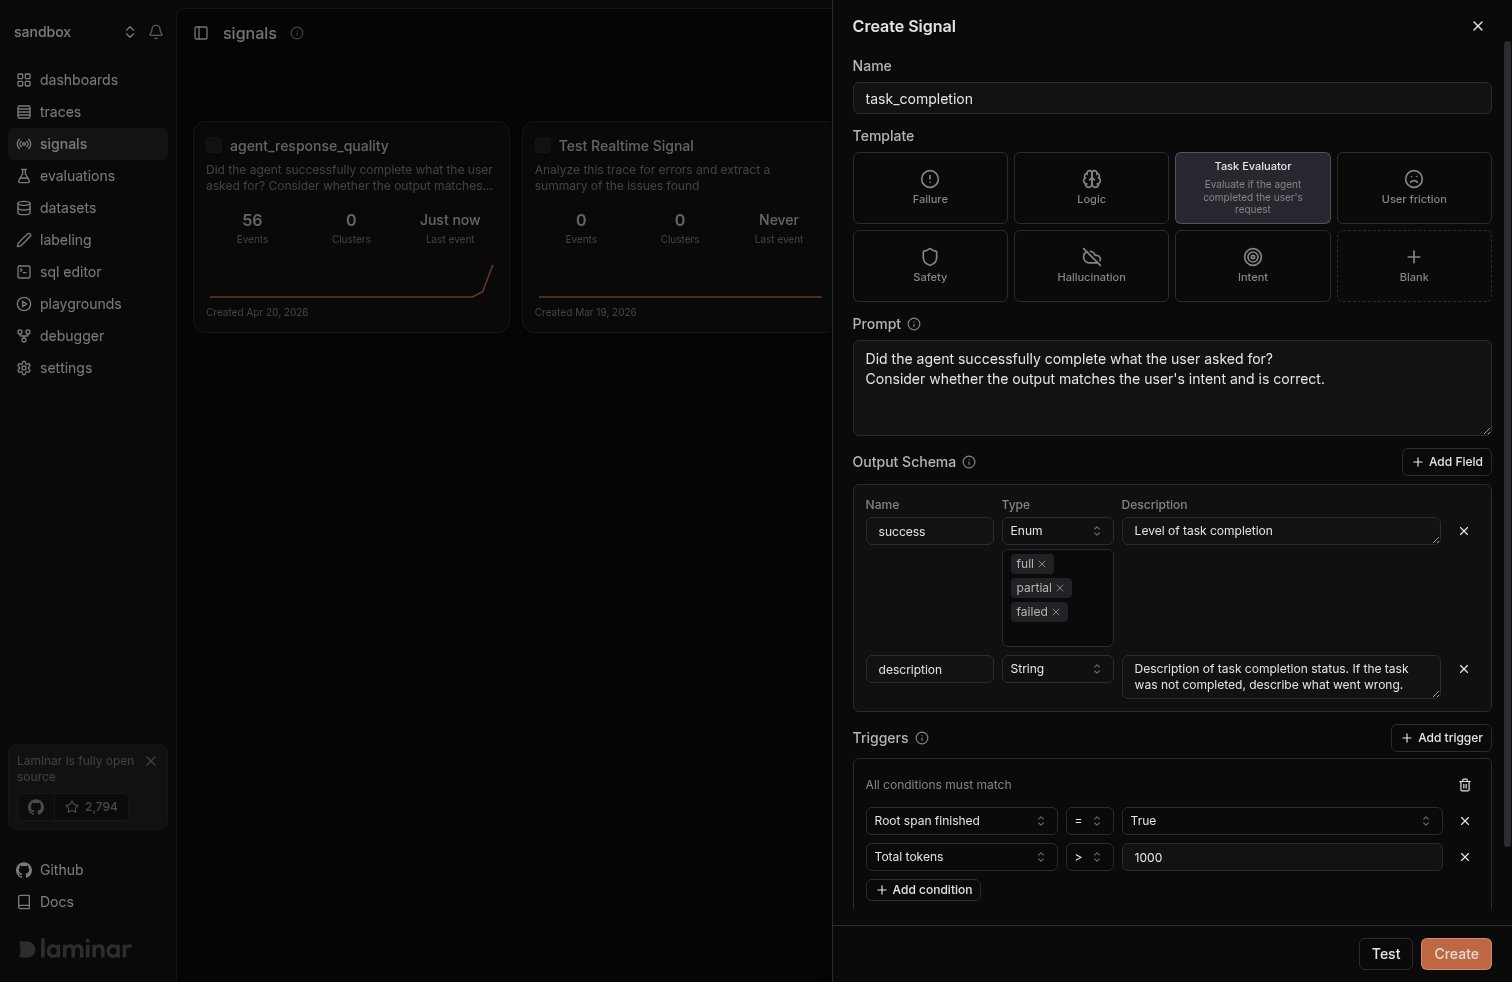
Fill in the form:- Name: a stable identifier. Use snake_case or dot-notation (
agent_response_quality,checkout.completed). The name is what you filter, alert, and query by. - Template (optional): pick a starting point. Laminar ships templates for task completion, user friction, safety, hallucination, and intent. Templates prefill the prompt and schema; edit both before saving.
- Prompt: describe what the Signal should detect or extract from the trace. Be concrete. “The agent answered the user’s question correctly and completely” is a better prompt than “good response”.
- Structured output: define the JSON schema for the payload. Keep fields small and stable; they become filterable columns on
signal_events. - Triggers: toggle on to run this Signal automatically on new traces. Add filters to narrow which traces it runs against.
- Sampling (optional): cap how many matching traces the trigger consumes per time window. Useful when a high-volume filter would otherwise fan out across every trace.
Creating a Signal automatically creates a Critical-severity event alert that posts to the in-app notification center. Open the Signal’s Settings > Alerts section (or Project Settings > Alerts) to route it to Slack or email, change the severity, or add output-schema filters. See Alerts.
4. Run the Signal: Triggers and Backfill
A Signal can run in two modes, independent of each other. Open a Signal and click Settings to manage both from a sidebar with four sections: General (definition and triggers), Alerts, Backfill, and Activity.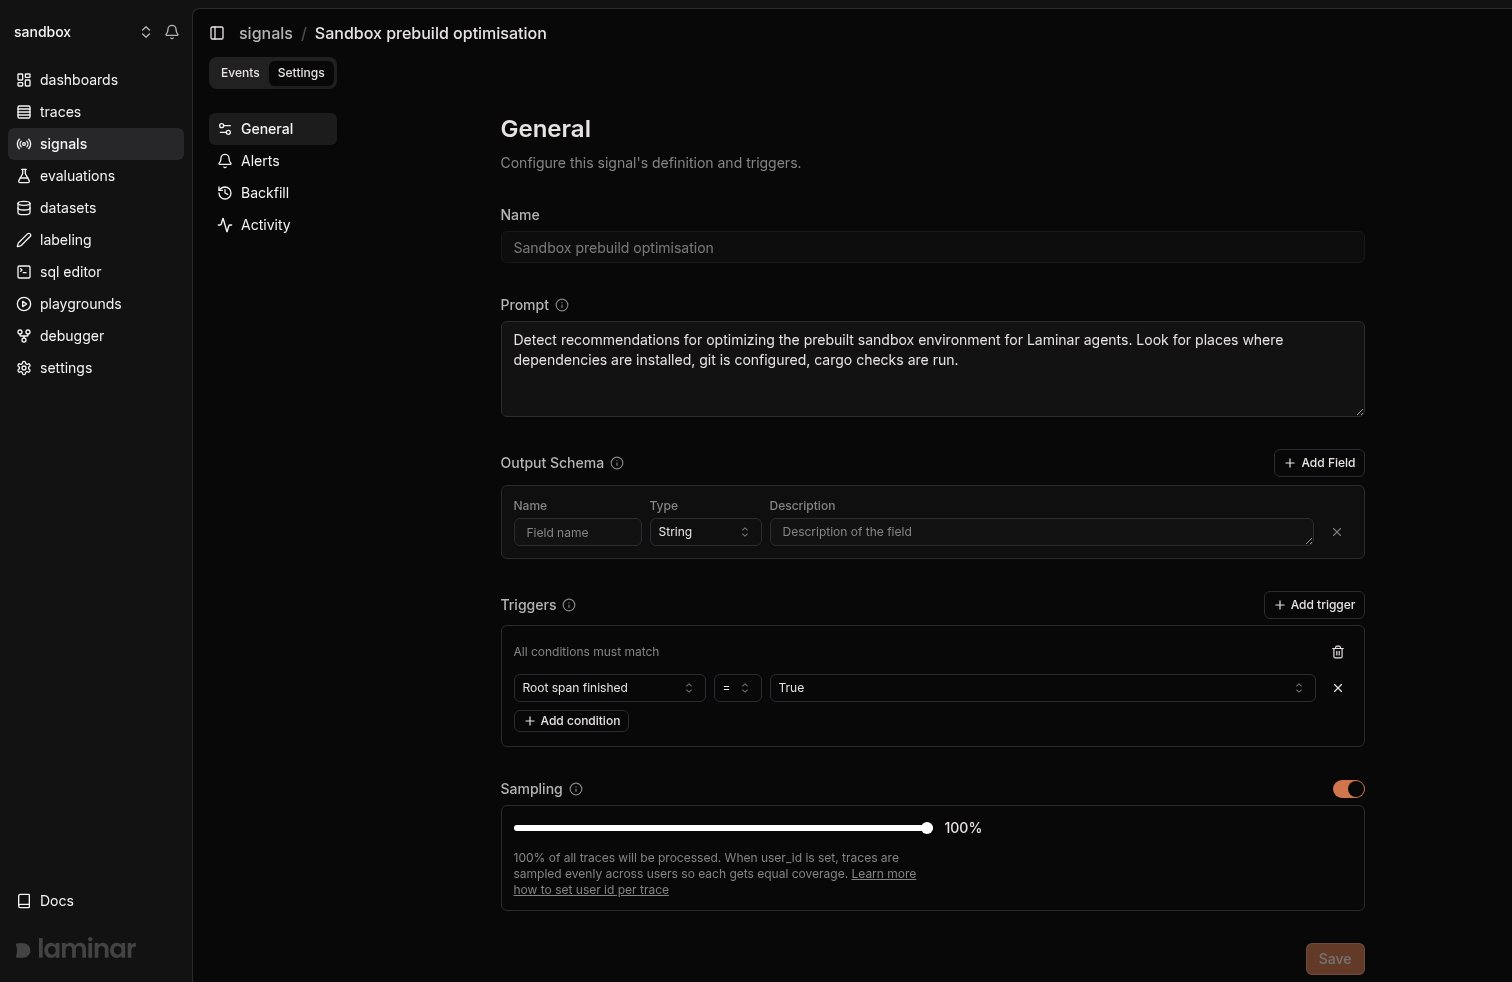
Triggers (live)
Triggers run the Signal automatically on new traces that match your filter set. This is what feeds live dashboards and Alerts.- Open the Signal’s Settings > General section and turn on Triggers (or configure Triggers while creating the Signal).
- Add one or more filters. All filters are AND-combined.
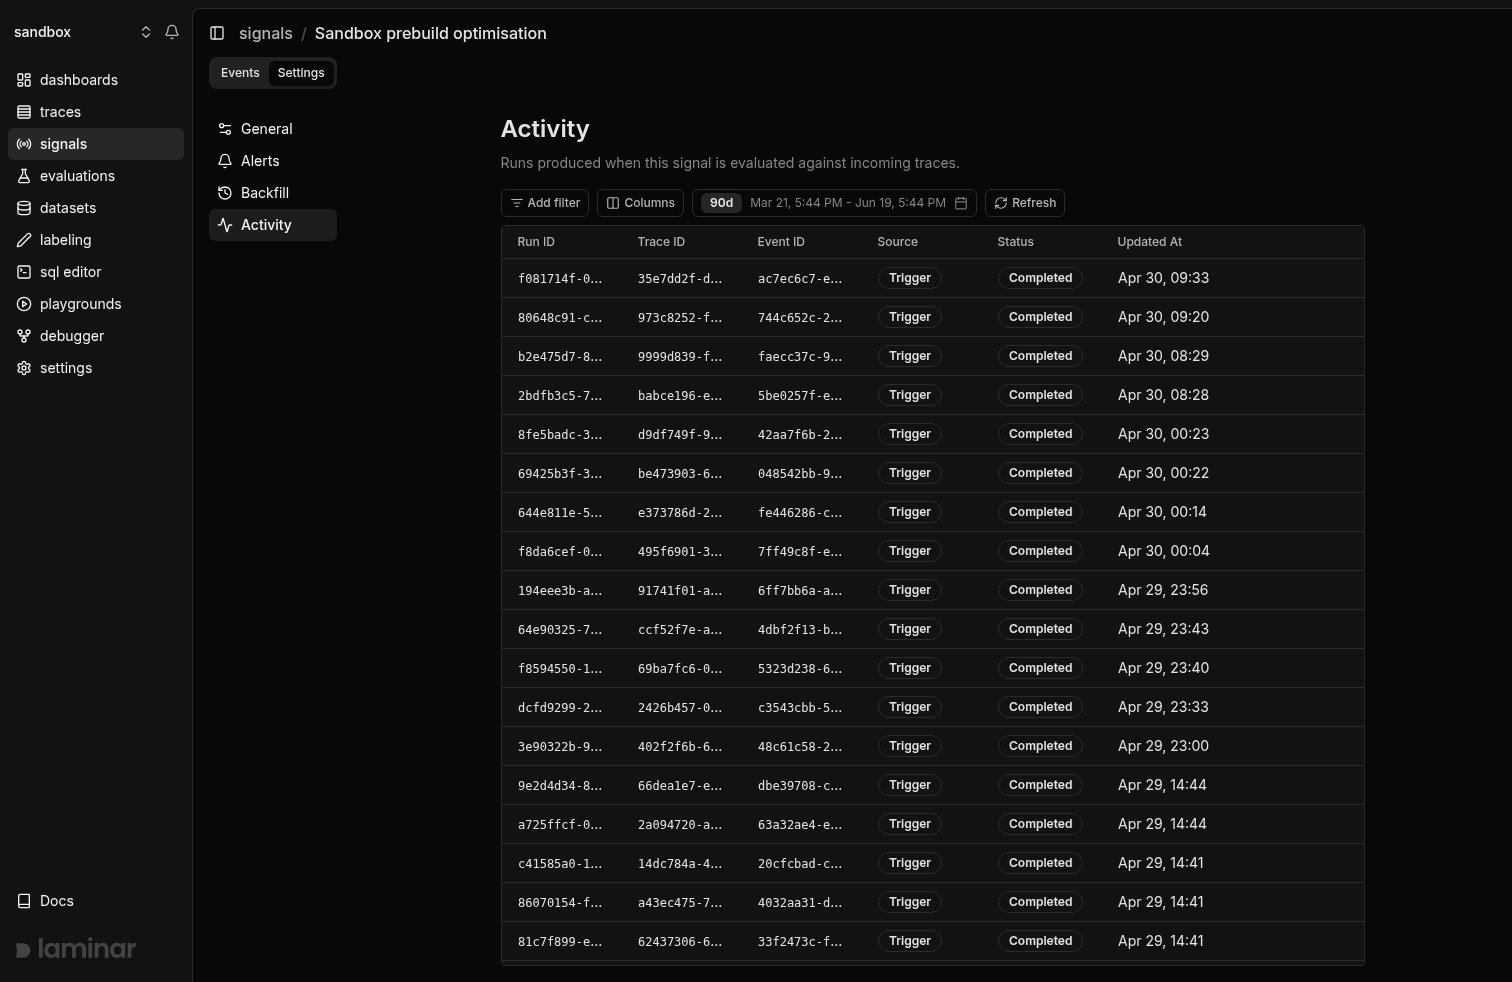
- Save. Every matching trace now produces a Run; runs that detect the Signal produce events.
Backfill (historical)
Use Backfill to run a Signal across historical traces, for example to evaluate a freshly-created Signal over the last 24 hours of traffic.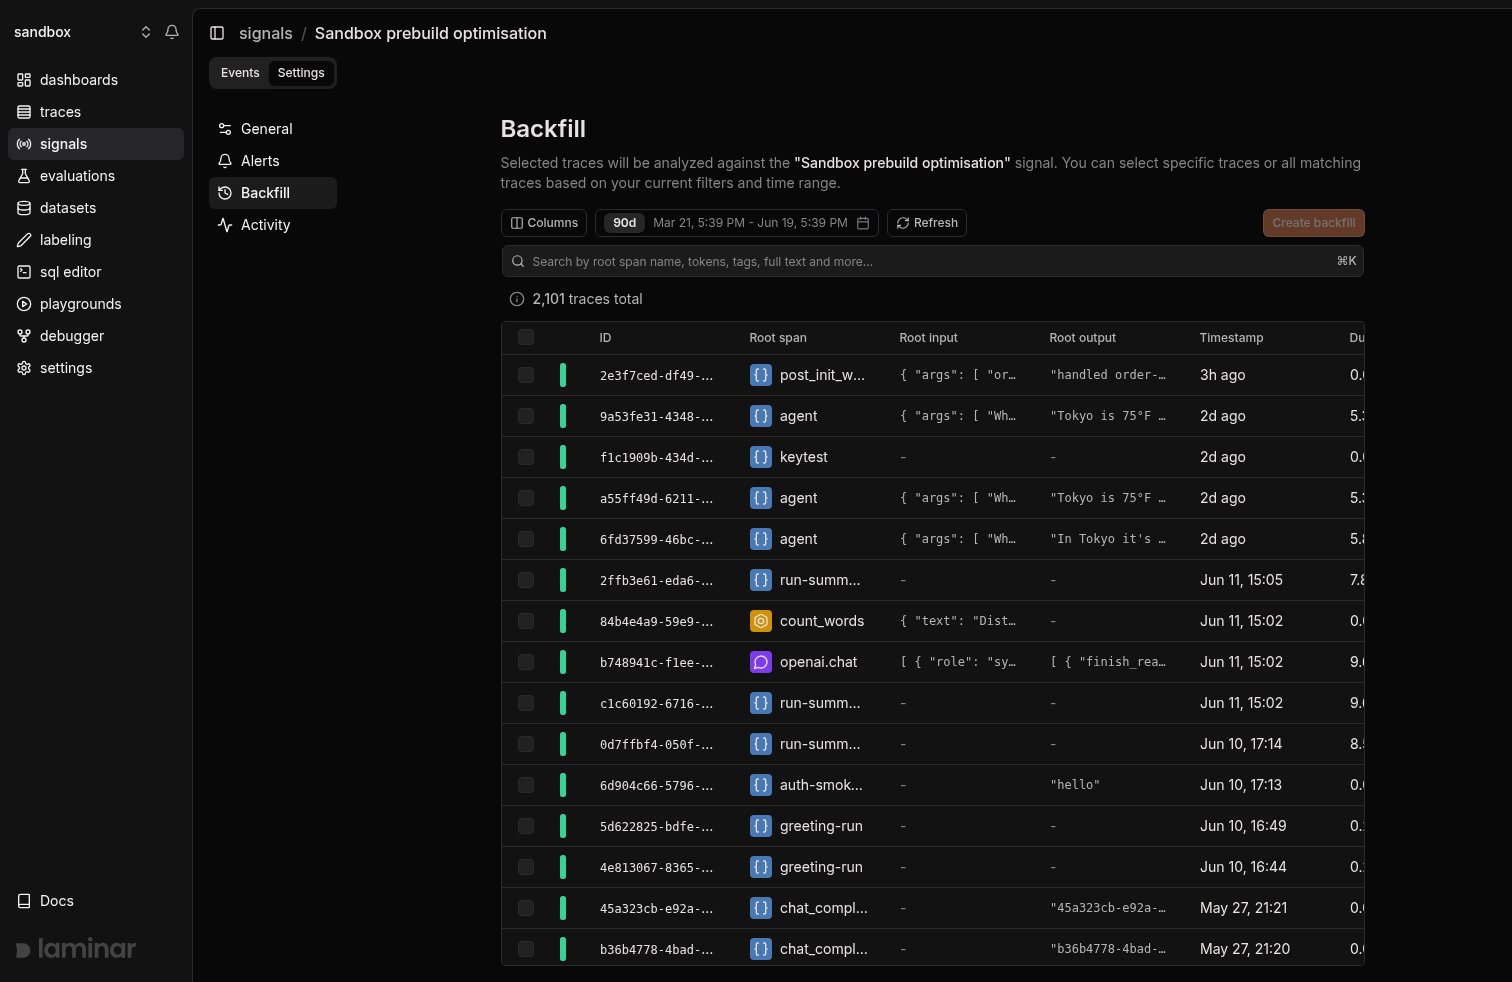
- Open the Signal’s Settings > Backfill section.
- Pick a time range (defaults to the last 24 hours).
- Optionally narrow with filters or search.
- Choose specific traces or all traces matching your filters.
- Click Start backfill. Laminar enqueues one Run per trace.
Pause and resume a Signal
A Signal you’re not ready to delete can be paused. Open the Signal’s Settings > General section and flip the Active switch off.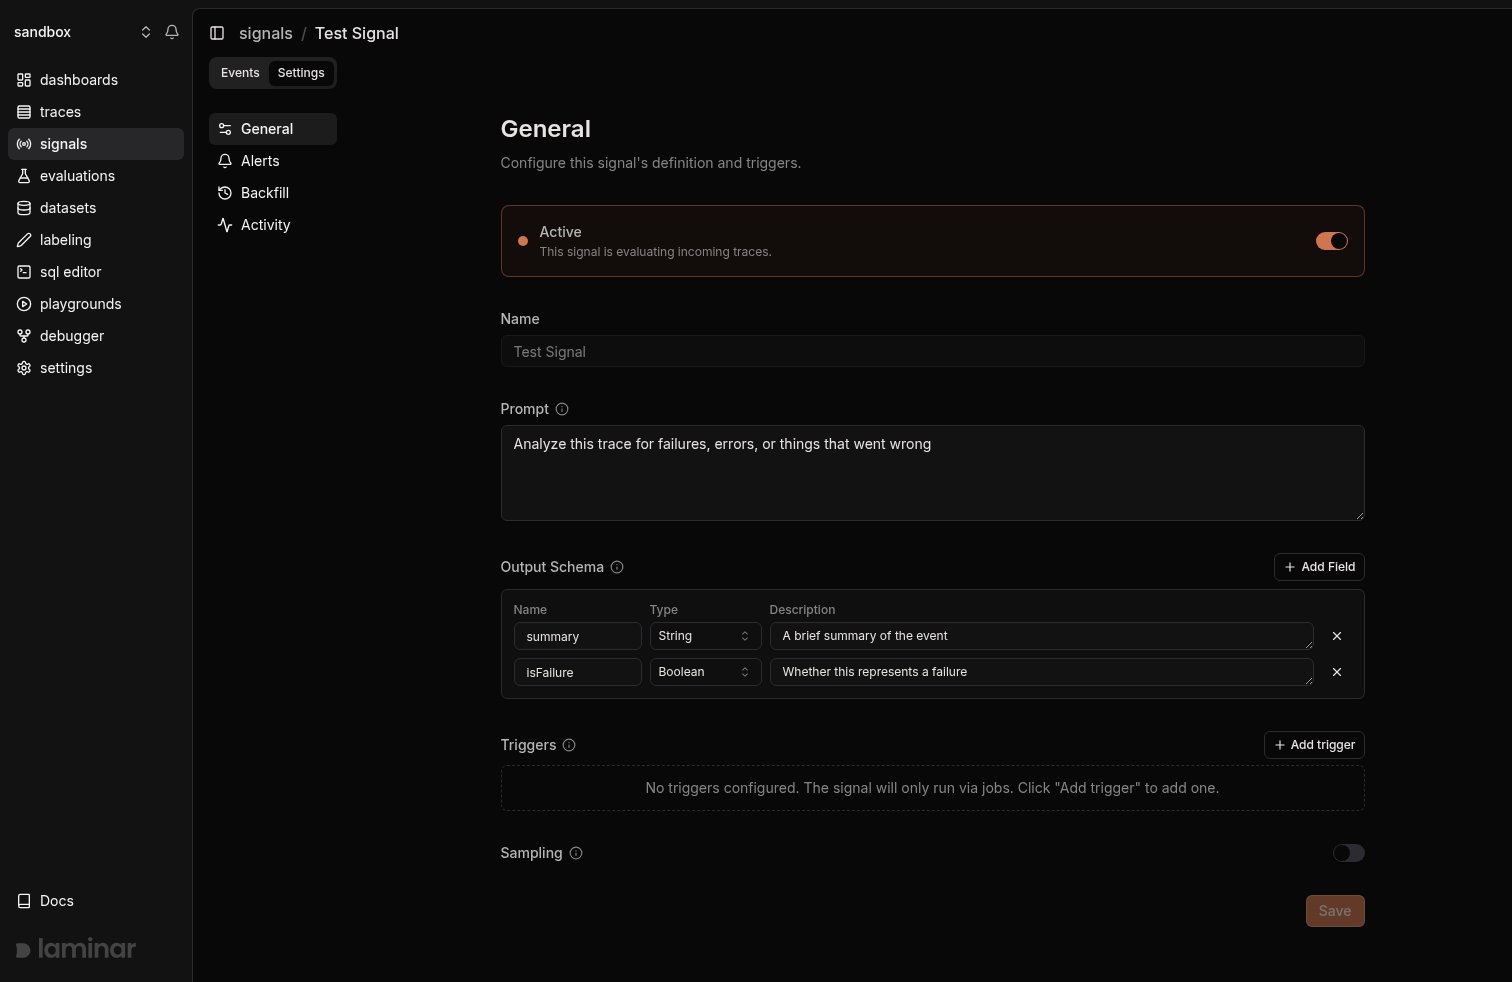
- New traces are not evaluated, even if they match the Signal’s triggers.
- Backfills are rejected until the Signal is re-enabled.
- Existing events and clusters are kept, and stay queryable in SQL and the UI.
- Alerts on the Signal stay configured but have nothing to fire on.
5. Inspect events
Open the Signal detail page and switch to the Events tab. Each row is one detected event, linked back to the trace that produced it.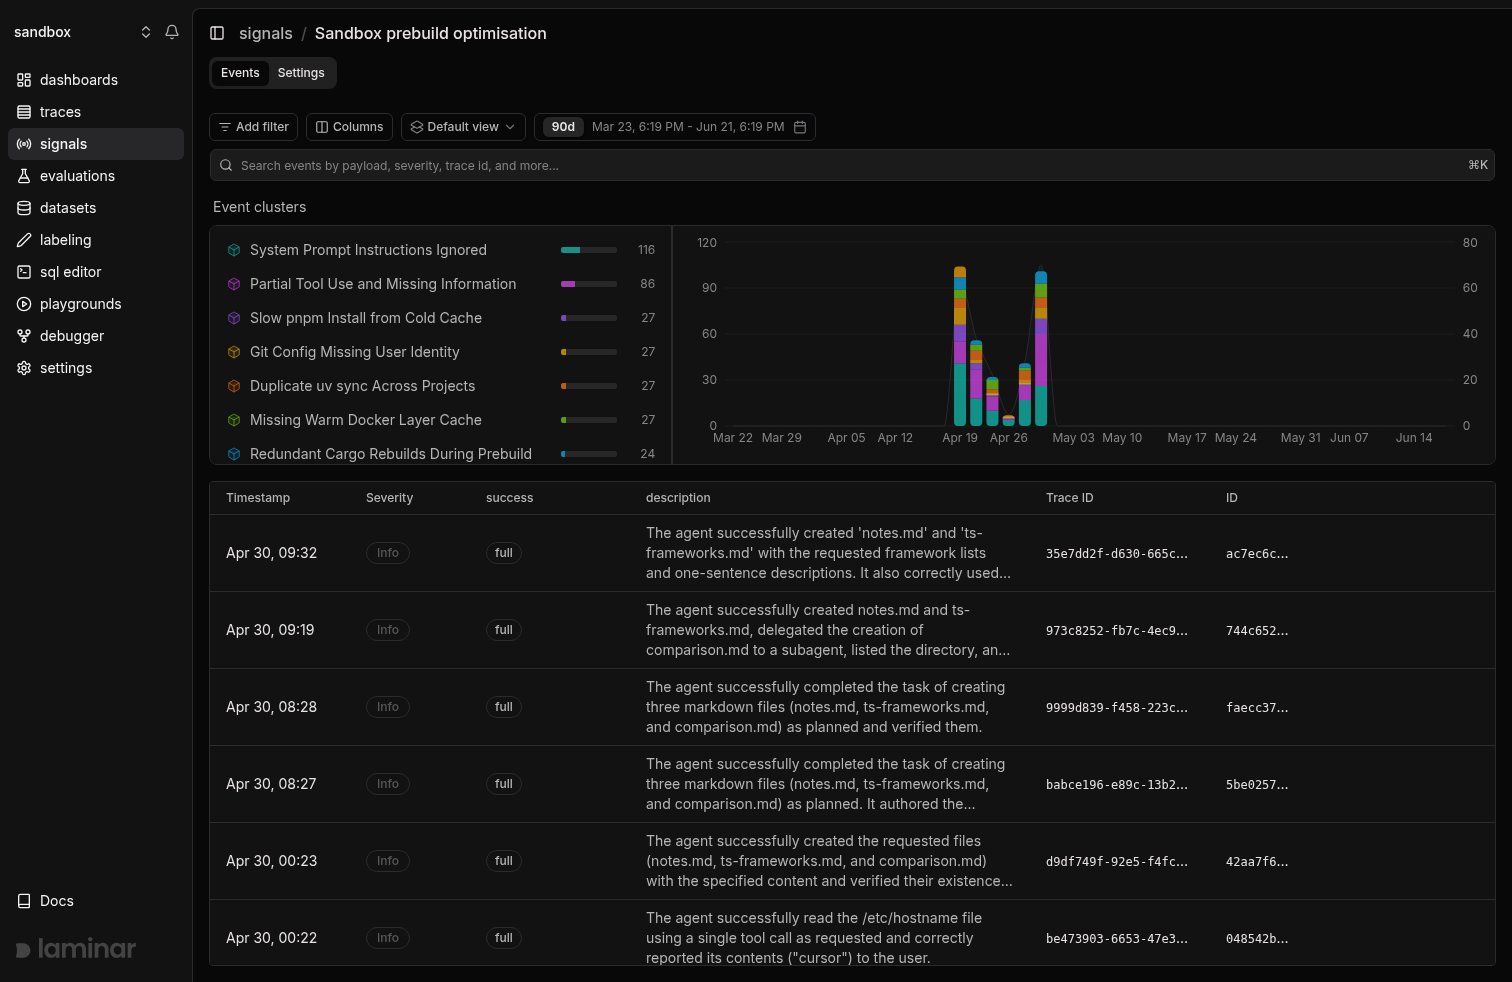
- Filter events by any field you defined in the structured output schema.
- Click any row to open the corresponding trace.
- Scroll to the clusters view below the events table to see similar events grouped together. See Clusters.
- Query the raw events in the SQL Editor via the
signal_eventstable.
Querying signal_events in SQL
signal_events stores each event’s payload as a JSON string. The UI’s payload filter uses simpleJSONExtractString / simpleJSONExtractRaw, so you can mirror the same behavior in SQL.
Quick payload filter (UI-equivalent)
Numeric comparisons with JSONExtractFloat
Typed or nested fields with JSONExtract
Next steps
Clusters
Group similar events into recurring patterns.
Alerts
Send Slack or email notifications on new signal events.