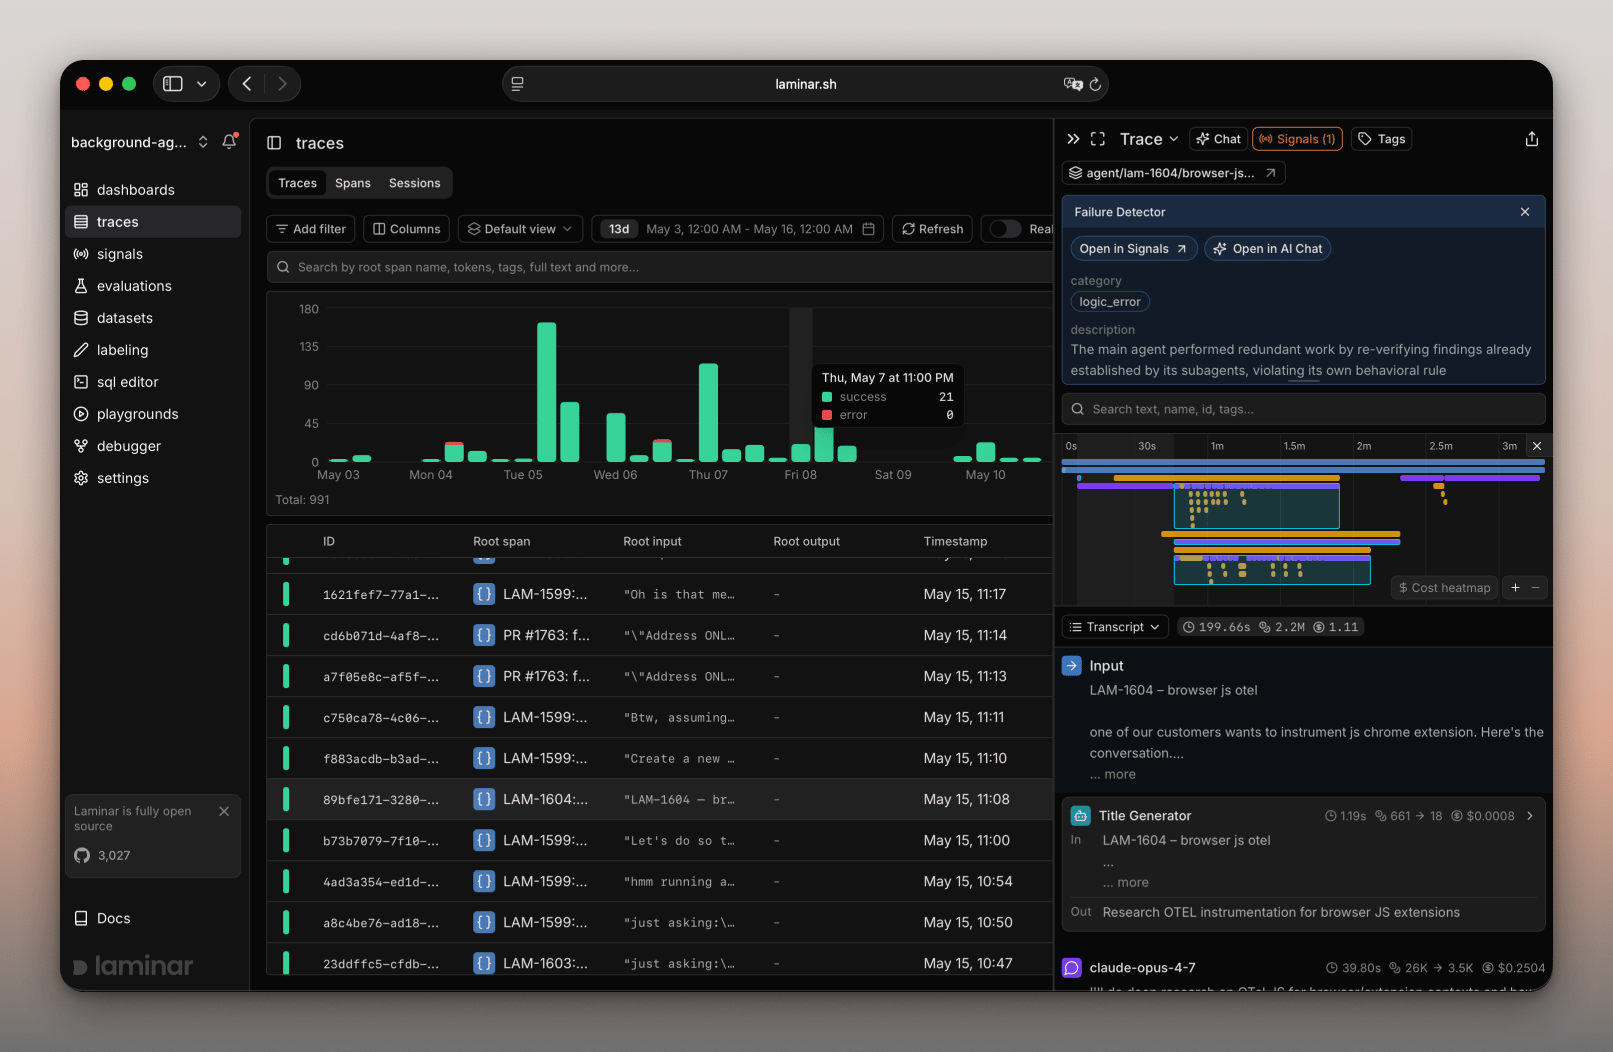
Tracing records what your agent does (LLM calls, tool use, and control flow) so you can debug individual runs and understand behavior over time. Tracing is also the entry point into Laminar: it’s how production runs become data in the platform. Once you’re tracing, you can read each run as a transcript in the trace view, define Signals to extract outcomes and failures across traces, and replay runs in the Debugger to reproduce and fix what went wrong. From there, turn real failures into Datasets and run comprehensive Evaluations.
Laminar trace view showing the traces list, transcript view, and an extracted signal

Where to Start

Integrations

You’re already using supported libraries. Learn what’s captured and how to configure instrumentation (including Browser Use and Stagehand).

Tracing Structure

You want deeper visibility into your own code. Trace your functions, create manual spans, add context, and control what’s captured.

Troubleshooting

You’re not seeing what you expect. Debug missing spans, auto-instrumentation issues, and common setup pitfalls.