
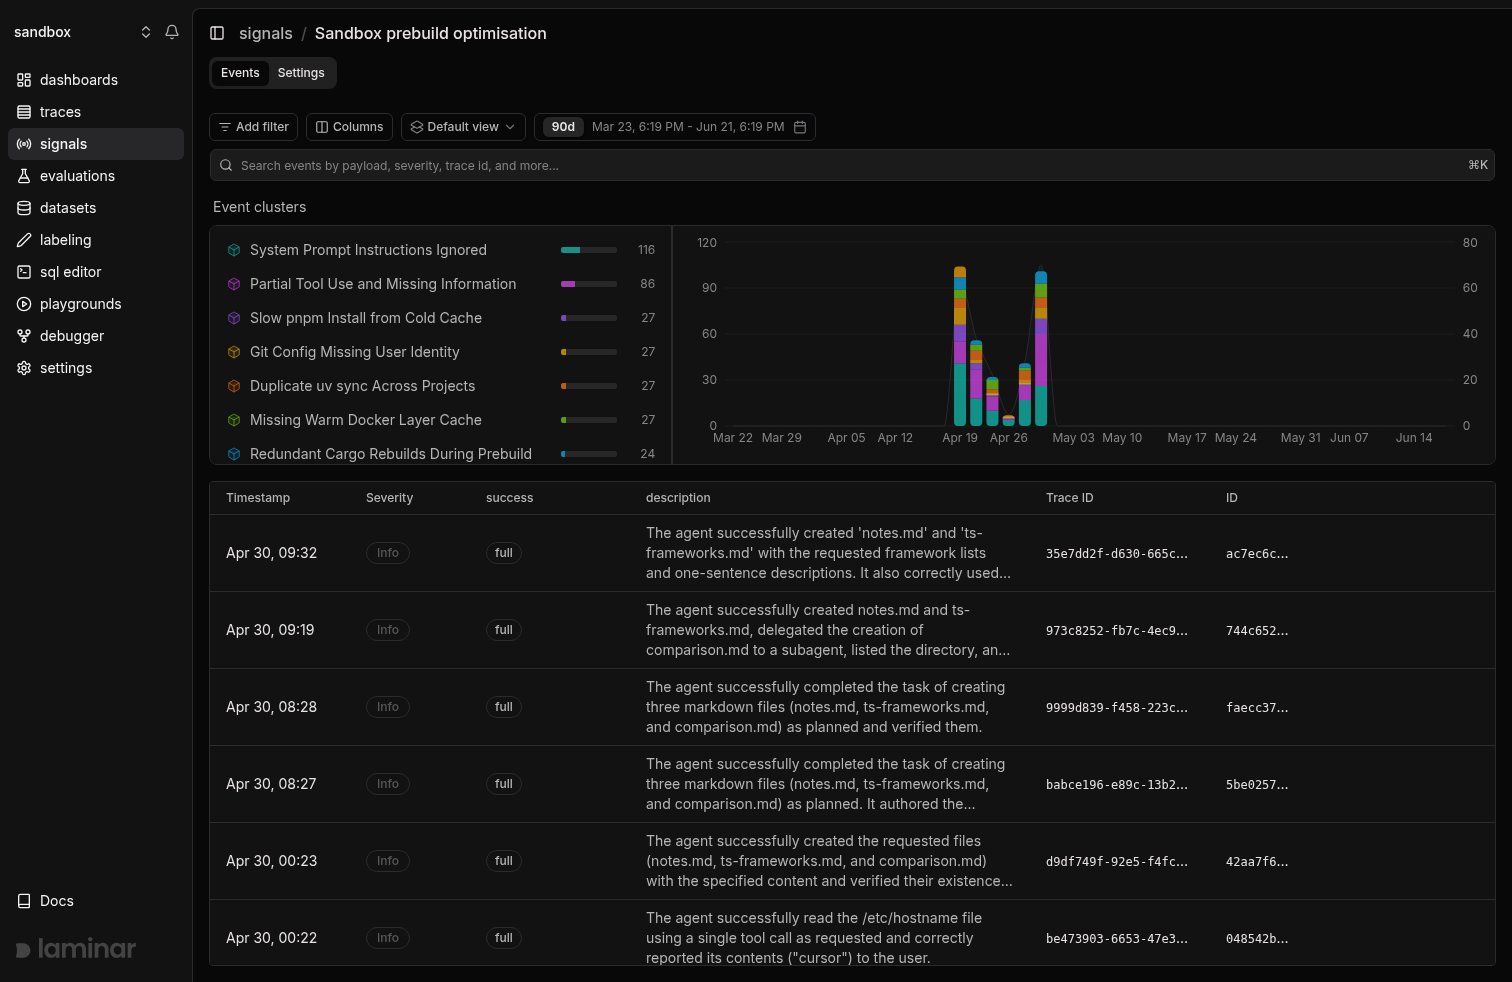
What Signals can help you answer
If you can describe it to a colleague, you can write a Signal for it.- Business outcomes: “agent completed checkout,” “agent answered the question correctly.”
- Logical failures: “agent loops on the same tool without progress,” “agent gave up after one retry.”
- Behavioral categorization: user intent, topic, any categorical field you want on the trace.
- User friction: “user asked for the same information multiple times”, “user gave up after multiple retries”.
- Cost and waste: “long context, short answer,” “tool called with malformed arguments and retried.”
Anatomy of a Signal
A Signal has three parts:- Prompt: plain-language instructions that describe what the Signal should detect or extract from an agent trace.
- Structured output schema: a JSON schema the extracted payload must conform to.
- Triggers: trace conditions that must be met for the Signal to run.
How a Signal run works
When a trace matches a Signal’s trigger conditions, Laminar doesn’t just paste the raw trace into a single LLM call. A Signal run is a small investigation, and it moves through three stages: compress the trace, let an agent investigate it, then turn what the agent found into events.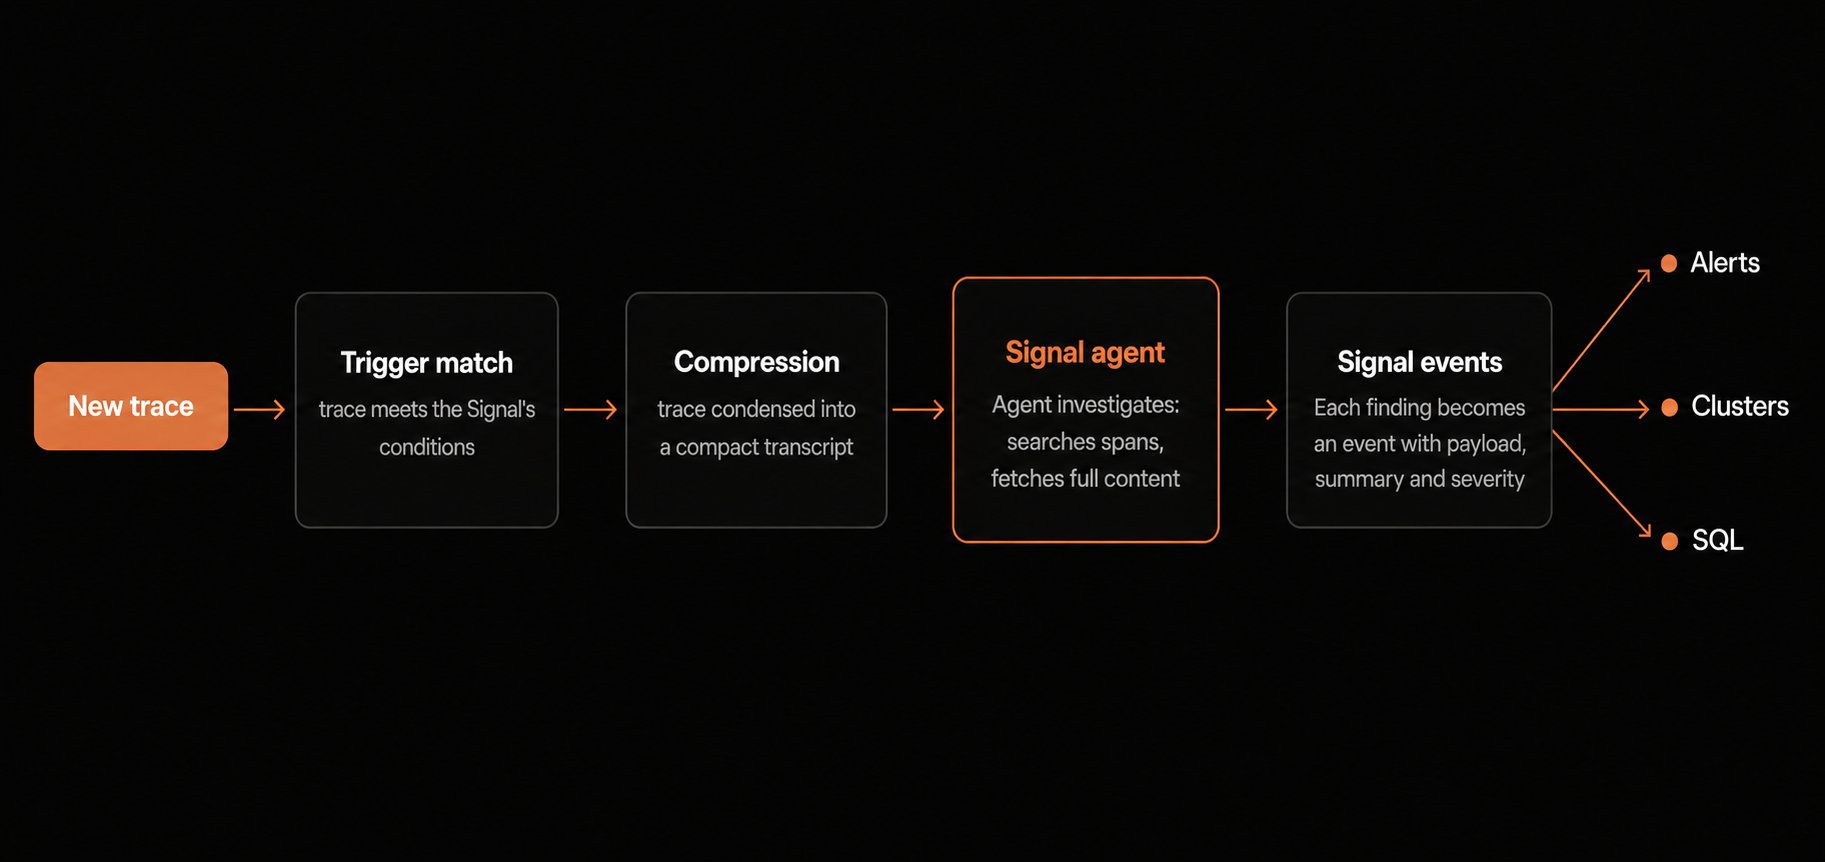
1. The trace is compressed
Agent traces are long. A single run can contain hundreds of spans, megabytes of tool output, and the same system prompt repeated on every LLM call. Before anything reads the trace, Laminar compresses it into a compact transcript:- LLM turns and tool calls are kept. These carry the story of what the agent did.
- Repeated system prompts are deduplicated and summarized, so the transcript states them once instead of on every turn.
- The user’s original request is extracted and placed up front, so the Signal always knows what the agent was asked to do.
- Plumbing spans are dropped unless they carry errors or match the Signal’s relevance rules.
Traces are compressed to around 10% of it’s original token count on average
2. An agent investigates the trace
Your prompt doesn’t run as a one-shot classification. Laminar runs it as an agent with tools, working over the compressed transcript across multiple steps:- It can search within span content to find where something happened.
- It can fetch the full input and output of any span by its reference id when the compressed view isn’t enough.
- When it has seen enough, it submits its findings and the run ends.
- The agent submits one or more findings. Each finding contains a payload that conforms to your schema, a short summary of what was found, and a severity (
critical,warning, orinfo). - The agent submits nothing, meaning the behavior you described wasn’t present in that trace. No event is created.
3. Findings become signal events
Each finding becomes a signal event linked back to the trace that produced it. From there, every event independently flows into the rest of the platform:- It’s indexed for search, so you can find it from the Signals UI.
- It’s checked against your alert rules (severity and custom payload filters), and matching events fire Alerts.
- It’s queued for clustering, where Laminar groups it with similar events from other traces so patterns surface as Clusters.
Signal events are accessible via the
signal_events table and can be easily queried using the SQL Editor. All signal events are linked to the traces that produced them. You can use event payloads to query corresponding traces. In a sense, you can think of a signal event payload as an additional column of the traces table.Run a Signal on new traces or historical traces
Each Signal can run in two modes, configured independently:- Triggers run the Signal on new traces as they arrive. Use Triggers for anything you want to watch in real time (live error rates, live success counts, anything that feeds Alerts). Trigger filters are AND-combined and are evaluated against accumulated trace state, so Signals fire once per matching trace.
- Backfill runs the Signal across a historical slice of traces. Use a backfill to seed a new Signal, re-run a changed prompt over last week’s traffic, or investigate a window of traces that match a filter.
Next steps
Quickstart
Write your first Signal, trigger it on new traces arriving in real-time, and see events.
Clusters
Learn how Laminar groups similar signal events so you can see patterns.
Alerts
Fire Slack or email notifications on new signal events or clusters.